3.8
Temperature Dependence of Resistivity
Current Electricity · CBSE
Theory
The relation
- Over a limited range of temperature that is not too large, the resistivity of a metallic conductor is approximately
- is the resistivity at temperature , the resistivity at a reference temperature , and the temperature coefficient of resistivity.
- Since and the dimensions barely change, the same relation may be used for resistance:
- is the fractional increase in resistivity per unit rise in temperature. Its dimension is (temperature), so the unit is K or C. For metals is positive.
- The relation implies that a graph of against is a straight line. At temperatures much below C the real graph deviates considerably from a straight line, so the formula may only be used over a limited range around .
Explaining the sign of — the marks are here
- Start always from the microscopic expression
- Resistivity depends inversely on both the free-carrier density and the average time between collisions.
- Raising the temperature increases the average speed of the electrons and makes the lattice ions vibrate more, so collisions become more frequent and decreases. This happens in every material.
- In a metal is essentially independent of temperature. With fixed and falling, increases: hence is positive for a metal.
- In a semiconductor or insulator, increases with temperature, and this increase more than compensates the decrease in . Hence decreases with temperature and is negative.
The three graphs to be able to sketch
- Copper (a metal): against is a curve that starts from a very small value near , rises, and becomes very nearly a straight line of small positive slope over the ordinary range of temperatures. Label the axes and and mark the near-linear region.
- Nichrome (an alloy): against absolute temperature is a straight line with a very small positive slope — nearly flat over the working range.
- A typical semiconductor: against is a curve falling steeply as increases, flattening at high temperature.
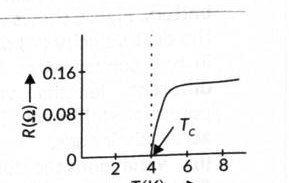
- Mercury near 4 K: the resistance decreases smoothly on cooling and then drops abruptly to zero at a critical (transition) temperature . Below , mercury offers no resistance at all to the flow of current — it becomes a superconductor.
Reading – graphs for resistance and temperature
- On a plot of (vertical) against (horizontal), , so is the reciprocal of the slope: the steeper line is the smaller resistance.
- Two wires of equal length and diameter at constant temperature, lines X (less steep) and Y (steeper): X carries less current for the same , so ; since with and equal, X is made of the material with the larger resistivity.
- The same metallic wire at two temperatures, steeper than : ; the resistance of a metal increases with temperature, so is the lower temperature.
Worked numericals in NCERT's own style
- Nichrome toaster. At C, . On 230 V the steady current is 2.68 A, so . With ,
- Platinum resistance thermometer. With at the ice point, at the steam point and in the bath,
Standard results
- , , in K.
- Metal: falls, fixed, rises, . Semiconductor: rises faster than falls, falls, . Alloy: .
- On an – graph, .
- Mercury becomes superconducting below .
- Platinum thermometer: .
Theory Questions Asked on This Subtopic
Real board questions. Answers are at the end of the page.
- 1
The – characteristics of two wires and at constant temperature are shown in the figure. The two wires have equal lengths and diameters. Which of them is made up of material of larger resistivity? [Graph: two straight lines through the origin, steeper than .]
- 2
– graph for a metallic wire at two different temperatures, and , is as shown in the figure. Which of the two temperatures is lower and why? [Graph: two straight lines through origin, steeper than .]
- 3
Plot a graph showing the variation of resistivity of a conductor with temperature.
- 4
Show the variation of resistivity of copper as a function of temperature in a graph.
- 5
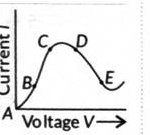
Plot a graph showing the variation of current versus voltage for the material GaAs.
- 6
How does one explain the increase in resistivity of a metal with an increase of temperature?
- 7
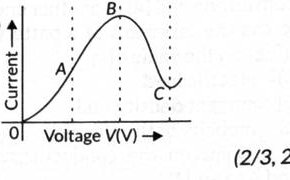
(i) The graph between resistance and temperature for Hg is shown in the figure. Explain the behaviour of Hg near 4 K. (ii) In which region of the graph shown in the figure is the resistance negative, and why?
Numericals
Every numerical set on this subtopic. Full working is at the end of the page.
- 8
Which of the following has negative temperature coefficient of resistivity?
- (a)
Metal
- (b)
Metal and semiconductor
- (c)
Semiconductor
- (d)
Metal and alloy
- (a)
Answers & Solutions
Work the questions above first, then check yourself here. Each answer is set out the way it should be written in the paper.
For the same applied voltage , wire carries a smaller current than (its line is less steep), so has the larger resistance. Since and have equal lengths and diameters, shows that a larger means a larger resistivity. Hence wire is made of the material with larger resistivity.
, so on an – graph, . Since line is steeper than , . The resistance of a metallic wire increases with temperature, so the wire with the smaller resistance is at the lower temperature. Hence , i.e. is the lower temperature.
For a metallic conductor, : the resistivity rises with temperature. Over the normal range of temperatures the resistivity-versus-temperature graph is very nearly a straight line with a small positive slope; at temperatures much lower than 273 K, however, the graph deviates considerably from linearity and falls off more steeply towards a small value as .
Like other metals, the resistivity of copper increases with temperature: the graph is a curve that rises from a small value near K, becoming nearly linear at higher (room-range) temperatures — consistent with .
The – graph for GaAs first rises non-linearly (region , roughly Ohmic near the origin), reaches a peak (region ), and then falls with increasing voltage in the region , showing negative resistance there, as shown in the figure (same graph as used for Q31/Q39 in this reference).
As temperature increases, the thermal vibrations of the lattice ions increase, causing the free electrons to collide with them more frequently. This decreases the relaxation time . Since , a decrease in (with practically unchanged for a metal) increases the resistivity.
(i) As Hg is cooled, its resistance decreases smoothly and then drops abruptly to zero at a critical (transition) temperature K. Below , Hg loses all resistance to current flow and becomes a superconductor. (ii) In the region between and , the current decreases as the voltage increases, i.e. . Since , the resistance in this region is negative.
Answer: (c) Semiconductor For semiconductors (and insulators), the temperature coefficient of resistivity is negative — resistivity decreases as temperature rises.