3.14
Spectral Distribution of Blackbody Radiation
Kinetic Theory of Gases and Radiation · Maharashtra HSC
Theory
What is being plotted
The radiant energy emitted per unit area per unit time by a blackbody depends on its temperature. Hot objects radiate electromagnetic radiation over a large range of frequencies, so the rate of emission per unit area, or power per unit area of the surface, is defined as a function of the wavelength of the emitted radiation. Spectral distribution of the power radiated by a body means the power radiated at different wavelengths.
At low temperature the power radiated is small and lies primarily in the long-wavelength region. As the temperature is increased the rate of emission increases fast. At each temperature the radiant energy contains a mixture of different wavelengths, and at higher temperatures both the total energy radiated per unit time and the proportion of energy emitted at higher frequencies (shorter wavelengths) increase.
The experiment
Lummer and Pringsheim studied the energy distribution of blackbody radiation as a function of wavelength. They kept the source of radiation — a cavity radiator — at different fixed temperatures and measured the radiant power corresponding to different wavelengths. The measurements were represented graphically as curves showing the variation of radiant power per unit area with wavelength at different constant temperatures. Experimental observations showed that the spectral distribution depended only on the absolute temperature of the blackbody and was independent of the material.
Diagram in words
Radiant power per unit area per unit wavelength range, , is plotted on the vertical axis against wavelength on the horizontal axis. There is one continuous hump-shaped curve for each temperature. Each curve starts from zero at , rises steeply to a maximum at a wavelength , and then falls off more slowly, approaching zero asymptotically at large . A curve for a higher temperature lies entirely above the curves for lower temperatures, and its peak is displaced towards shorter wavelengths, that is, to the left. The dotted line joining the peaks of successive curves therefore slopes to the left as increases.
Observations from the curves
1. At a given temperature, the energy is not uniformly distributed in the spectrum of the blackbody, that is, as a function of wavelength.
2. At a given temperature, the radiant power emitted initially increases with increase of wavelength, reaches a maximum, and then decreases.
3. The wavelength corresponding to the radiation of maximum intensity, , is characteristic of the temperature of the radiating body. It is not the maximum wavelength emitted by the object.
4. The area under a curve represents the total energy emitted per unit time per unit area by the blackbody at all wavelengths.
5. The peaks of the curves shift towards the left, to shorter wavelengths: the value of decreases with increase in temperature.
6. At higher temperatures, the radiant power or total energy emitted per unit time per unit area corresponding to all wavelengths — the area under the curve — increases.
7. At a temperature of 300 K, around room temperature, the most intense of these waves has a wavelength of about m, and the radiant power is smaller for other wavelengths. Practically all the radiant energy at this temperature is carried by waves longer than those of red light; these are infrared radiations.
Wien's displacement law
It is observed that the wavelength for which the emissive power of a blackbody is maximum is inversely proportional to the absolute temperature of the blackbody. This is Wien's displacement law.
where is Wien's constant, of value m K.
indicates the wavelength at which the blackbody dominantly radiates, so it corresponds to the dominant colour of the radiating body and is a function of its temperature. White dwarfs are hot stars with surface temperature about 10000 K, while red giants are cooler, with surface temperature about 3000 K. The law is used to determine the temperatures of distant stars, the Sun and the Moon.
Worked value: for the Sun, taking the surface temperature as 5800 K,
which lies in the visible region of the electromagnetic spectrum.
The theoretical background
A theoretical explanation of these observations could not be given by the theories then existing.
- Wien gave an expression for the spectral distribution from the laws of thermodynamics, which fitted the experimental observations only for short wavelengths.
- Lord Rayleigh and Sir James Jeans gave a formula from the equipartition of energy, which fits well in the long-wavelength region but tends to infinity at short wavelengths.
- It was therefore essential to propose a new model. Planck, aware of the shortcomings of both, combined them using an empirical formula and could describe the observed spectrum quite well.
Planck's quantum hypothesis: he considered the atoms of the walls of the cavity as tiny electromagnetic oscillators with characteristic frequencies that exchange energy with the cavity, and supposed this energy could have only the specific values
where is the frequency of the oscillator, J s is a universal constant, and takes only positive integral values. The oscillators do not radiate energy continuously but only in jumps or quanta, corresponding to transitions from one quantised energy level to another of lower energy; while in one of the quantised states the oscillator neither emits nor absorbs energy.
Standard results
- is the wavelength of maximum intensity, not the longest wavelength emitted.
- Area under the versus curve = total power radiated per unit area at that temperature.
- The distribution depends only on the absolute temperature of the blackbody, not on its material.
Theory Questions Asked on This Subtopic
Real board questions. Answers are at the end of the page.
- 1
Represent graphically energy distribution of a black body against wavelength at various temperatures.
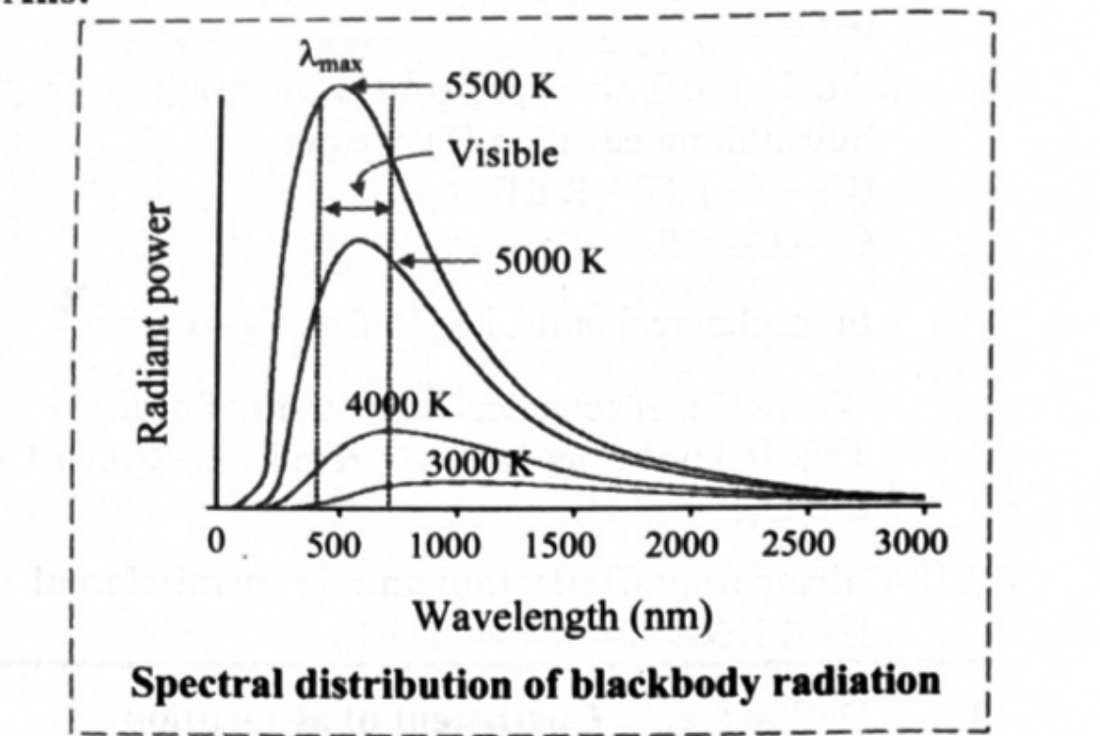 Maharashtra HSC board question — asked in October 2009Answer 1 ↓
 - 2
Explain blackbody radiation spectrum in terms of wavelength.
Maharashtra HSC board question — asked in October 2013Answer 2 ↓ - 3
Show graphical representation of energy distribution spectrum of perfectly blackbody.
Maharashtra HSC board question — asked in March 2014Answer 3 ↓ - 4
State Wien's displacement law.
Maharashtra HSC board question — asked in March 2015Answer 4 ↓ - 5
Explain energy distribution spectrum of a black body radiation in terms of wavelength.
Maharashtra HSC board question — asked in February 2020; October 2008Answer 5 ↓
Answers & Solutions
Work the questions above first, then check yourself here. Each answer is set out the way it should be written in the paper.
The question is a real board question. Its answer and working are ours — this paper was published without an official answer key.
The graph
Diagram in words, as it should be drawn and labelled:
- Plot the radiant power per unit area per unit wavelength range, , on the -axis, against the wavelength on the -axis.
- Draw a family of continuous hump-shaped curves, one for each temperature, labelled , , , with .
- Every curve starts from zero at , rises steeply to a single maximum at a wavelength , and then falls off more slowly, approaching the -axis asymptotically at large .
- The curve for a higher temperature lies entirely above those for lower temperatures, and its peak is displaced towards shorter wavelengths, that is, to the left.
- Mark on the -axis below the peak of each curve, and join the successive peaks by a dotted line; this dotted line slopes to the left as the temperature increases.
What the graph shows
1. At a given temperature the energy is not distributed uniformly over the wavelengths of the blackbody spectrum.
2. At a given temperature the radiant power first increases with wavelength, reaches a maximum at , and then decreases.
3. The area under any one curve gives the total energy emitted per unit time per unit area by the blackbody at that temperature, over all wavelengths. This area increases with temperature, in accordance with Stefan's law, .
4. decreases as the temperature increases, the peaks shifting to the left. This is Wien's displacement law:
5. is the wavelength of maximum intensity, not the maximum wavelength emitted by the body.
6. The distribution depends only on the absolute temperature of the blackbody and not on the material of which it is made.
i. The rate of emission per unit area or power per unit area of a surface is defined as a function of the wavelength λ of the emitted radiation. ii. Scientists studied the energy distribution of blackbody radiation as a function of wavelength. iii. By keeping the source of radiation (such as a cavity radiator) at different temperatures they measured the radiant power corresponding to different wavelengths. The measurements were represented graphically in the form of curves showing variation of radiant power per unit area as a function of wavelength λ at different constant temperatures as shown in figure. Refer Subtopic 3.14: Q. No. 1 for figure.
Refer Subtopic 3.14: Q. No. 1(Diagram only)
The wavelength, for which emissive power of a blackbody is maximum is inversely proportional to the absolute temperature of the blackbody.
[From 3.14, Q2]
i. The rate of emission per unit area or power per unit area of a surface is defined as a function of the wavelength λ of the emitted radiation. ii. Scientists studied the energy distribution of blackbody radiation as a function of wavelength. iii. By keeping the source of radiation (such as a cavity radiator) at different temperatures they measured the radiant power corresponding to different wavelengths. The measurements were represented graphically in the form of curves showing variation of radiant power per unit area as a function of wavelength λ at different constant temperatures as shown in figure. Refer Subtopic 3.14: Q. No. 1 for figure.